The True Benefit of Good Decision-Making: An Applied Case Study on PV and Hybrid Optimization in Sweden

How our client unlocked +1 mEUR in project value—without changing grid capacity, land or adding BESS—by leveraging AI-driven design.
This fully merchant project (no PPA) required advanced financial modeling and robust optimization to navigate price volatility and revenue uncertainty. This case study outlines how FIDgate’s proprietary tools—built on advanced simulation techniques and financial modeling—helped the team uncover layout “sweet spots,” reduce LCOE, and boost project IRR under land, grid, and CAPEX pressures.
In solar and hybrid projects, risk doesn’t wait until construction—it begins the moment financial models are built on static layouts and best-guess assumptions.
Project developers face pressure to define layouts before key trade-offs are explored. Financial teams are handed models that may look bankable—but lack scenario testing or sensitivity to real-world constraints like curtailment, CAPEX volatility, terrain limitations, municipal zoning rules, or capital availability—just to mention a few. And by the time investors step in, design flexibility is gone and project value has already been capped.
As renewable projects push into more complex configurations—hybrid sites, co-location, grid limits, shared infrastructure—the risks of early-stage misalignment only grow. A layout that looks “standard” can result in higher curtailment, lower returns, or inflexible PPAs.
That’s why we created FIDgate: to make smarter, faster, financially-driven design decisions possible—before you commit to a layout, financing structure, or technology path.
What If You Could Ask:
- What if we use a different module, substructure, or inverter set?
- Which layout delivers the best IRR under hybrid curtailment rules?
- How sensitive is the business case to solar data sources or CAPEX stress?
Platforms like FIDgate now make that possible—blending engineering logic with financial modeling before the Final Investment Decision (FID).
The PPA Crunch — and Why Better Design Still Matters
Across Europe, a growing gap between buyer and seller expectations is making it harder to close green PPAs.
In the Nordics, low capture rates and seasonal oversupply are compressing revenues. In some countries, solar capture rates dropped to 75% of average spot prices.
To adapt, developers are:
- Adding batteries to shift output
- Offering grid services to stack value
But the BESS market is still immature. Investors rely on uncertain revenue forecasts or backtests that often lack transparency.
Before investing in storage, developers can strengthen their base case by optimizing PV layout, sizing, and hybrid configurations.
From Weeks to Minutes: Rethinking Early-Stage Optimization
Traditionally, early-stage project design means juggling multiple tools, consultants, and disconnected workflows. Developers start by sketching layouts in AutoCAD or PVcase, hand over PDFs to finance teams running Excel models, and contract external advisors to validate only a handful of design options. The result? Weeks of iteration—often around pre-selected configurations that limit what’s financially and technically possible.
But now there’s a faster, smarter way to optimize solar and hybrid projects—before committing to design or investment.
FIDgate has already been applied to over 250 MW of real projects, helping developers, IPPs, and investors unlock 5% to 15% higher returns by simulating thousands of layout configurations in minutes—not weeks. By unifying engineering and financial logic in a single platform, FIDgate reveals profitable scenarios that would otherwise be missed by traditional workflows.
Today, our team uses FIDgate internally to support developers, IPPs, and investors in bringing system design, performance analysis, and financial modeling into the earliest stages of project development.
FIDgate is a powerful tool that helps optimize layout, components, and financial performance in tandem. It can iterate through hundreds of thousands of possible configurations—evaluating how different inverter types (central vs string), module power classes (e.g., 600+ W vs 700+ W), and racking systems (1P tracker, 2P/3P fixed-tilt) impact both energy yield and capital efficiency. For example, FIDgate is used to assess when a 3P fixed-tilt array outperforms a 1P tracker, or when a 2P fixed-tilt layout offers better land utilization and curtailment performance compared to a 3P system under grid constraints in a hybrid setup. These insights allow teams to make smarter equipment choices without sacrificing financial returns.
Built for speed and scale, FIDgate runs in the cloud—making it easy to simulate hundreds of designs, equipment sets, and financial assumptions in parallel. We can import modules, inverters, and cost data, define real-world constraints like curtailment or CAPEX ceilings, and instantly run performance and financial models, including IRR and LCOE calculations. Instead of waiting days for manual iterations, we help clients by accelerating decision-making and validating project economy in a fraction of the time.
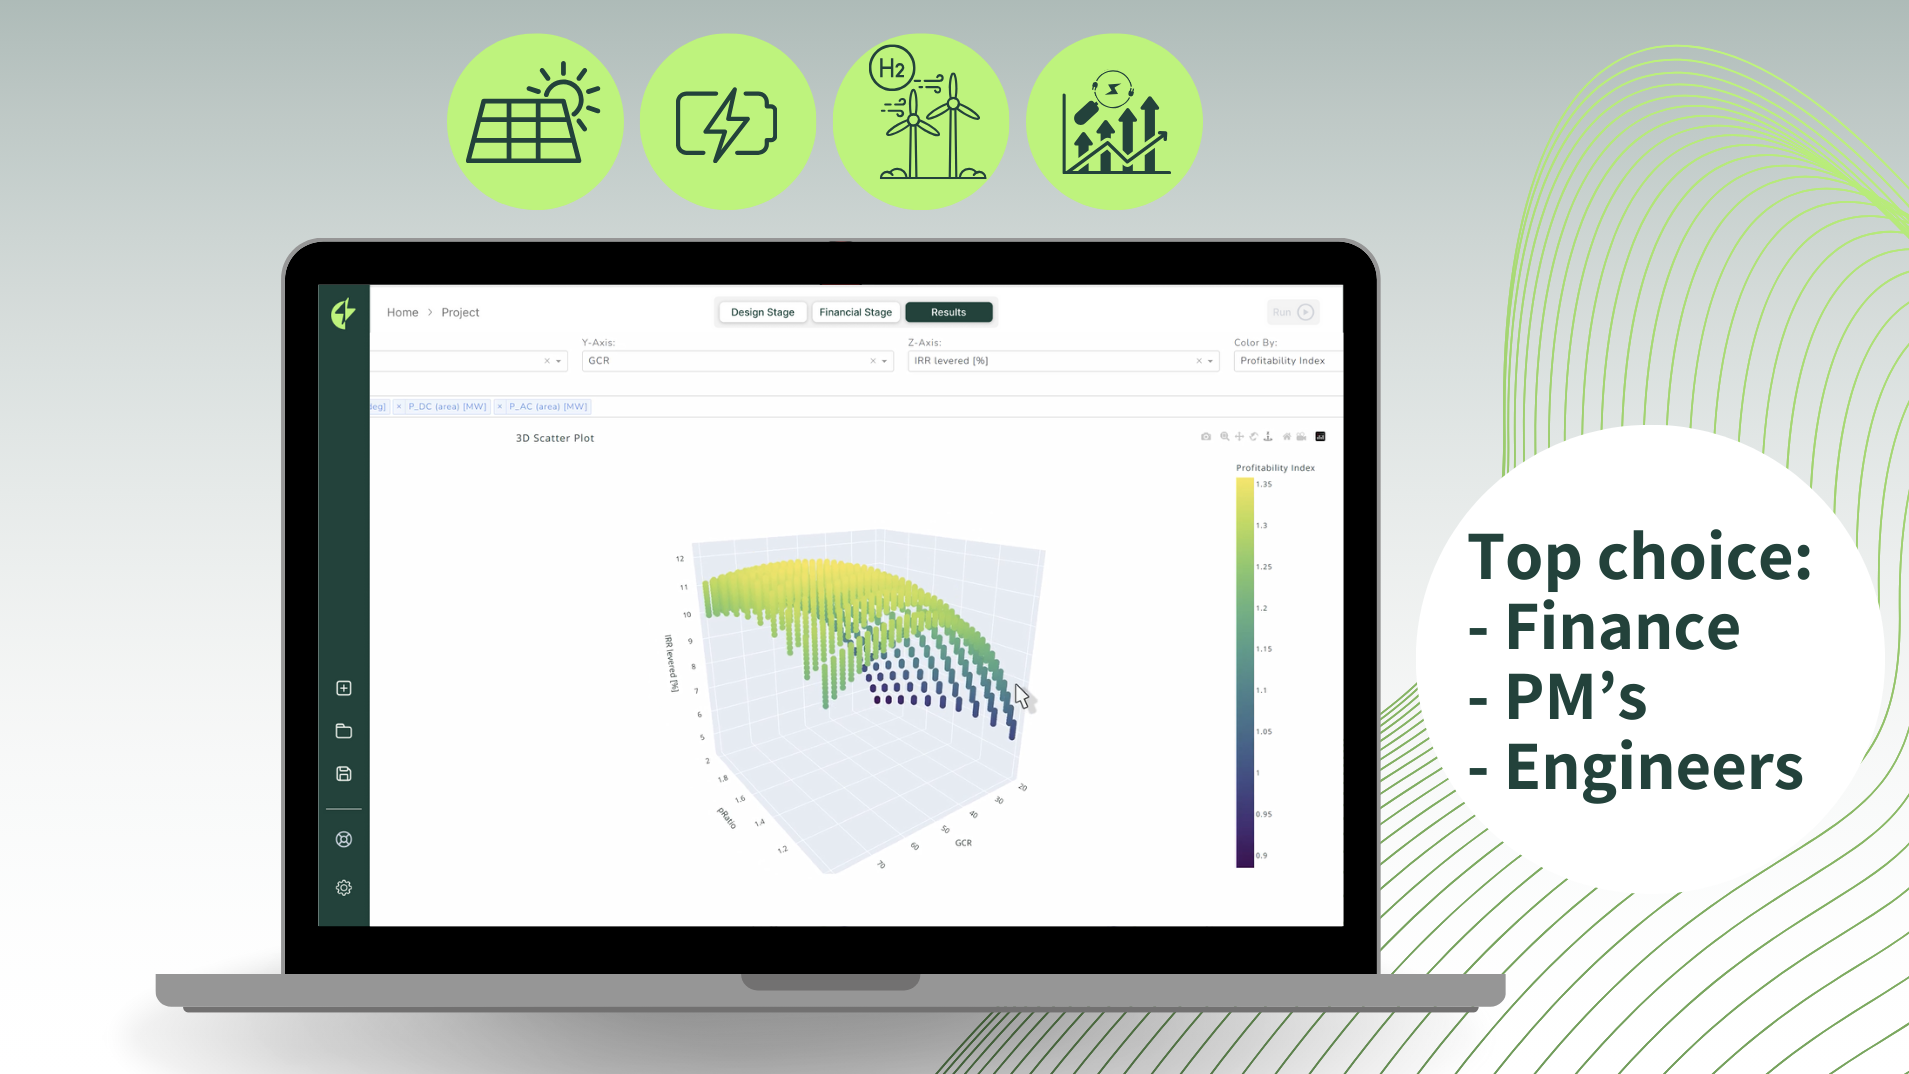
FIDgate generated a heat map of thousands of layout configurations, representing the trade-off between the multiple parameters and rate of return (IRR%).
Southern Sweden Hybrid Project
Site Context:
- Colocated PV + operational 50MW wind
- Fixed land parcel
- Grid capacity shared with wind
Outcome:
- €1M+ in NPV uplift through layout and configuration optimization
- IRR plateaus identified across tracker and fixed-tilt designs
- Enabled fast, scenario-based iteration under real CAPEX and curtailment constraints
What We Learned
Using FIDgate, we simulated thousands of hybrid configurations to understand how tracker and fixed-tilt systems performed under grid, land, and financial limitations. While SAT (single-axis tracker) systems delivered higher IRR—6.3% above fixed-tilt—the gain came alongside significantly lower plant size. SAT had 30% less DC capacity, 24% less AC power, and 16.5% lower annual energy output compared to the optimized fixed-tilt system.
However, that smaller plant size also brought advantages: CAPEX was reduced by over 20%, and grid curtailment dropped by nearly 60%. This efficiency enabled the tracker configuration to outperform fixed-tilt in IRR, LCOE, and equity return metrics—despite its lower absolute production.
Interestingly, the lower CAPEX and OPEX helped keep NPV within ~12% of the fixed-tilt design, meaning developers can achieve stronger returns while investing less—especially valuable in capital-constrained or grid-limited contexts.
Key Takeaways for Investors and Developers:
✅ AI-based scenario analysis outperforms manual heuristics and “best practice” defaults
✅ High-IRR zones provide flexibility to absorb design or CAPEX shifts—critical for permitting, procurement, and financing
✅ Systematic design-response mapping reveals profitable sweet spots that conventional processes often miss
Mapping Profitability Stability Zones: Smarter Layouts for Real-World Conditions
As part of this case study, we introduced a new method to help project teams visualize design flexibility under economic stress: Profitability Stability Zones—ranges of system configurations that maintain strong financial outcomes across varying CAPEX, curtailment levels, and price environments.
Rather than focusing on a single “optimal” configuration, FIDgate simulates and maps hundreds of layout alternatives—highlighting those that deliver consistent IRR performance despite changes in cost assumptions or market volatility.
FIDgate automatically places all key scenarios on this map, including the client’s baseline layout and all proposed alternatives—making it easy to compare options and identify resilient designs that don’t sacrifice profitability when real-world constraints shift.
- This enables development and investment teams to identify configurations that remain financially robust—even under late-stage changes to equipment pricing, EPC negotiations, or capital structure.
Even better: FIDgate can layer in market-specific power price scenarios, and capture price curves for wind and PV—helping you test how a given configuration holds up across 30+ years of forecasted conditions.
With this tool, you can:
Compare layouts side-by-side across key metrics (IRR, LCOE, curtailment)
Set your baseline, then explore sensitivities in both relative and absolute terms
Export results in spreadsheet-compatible format for further analysis or investment modeling
📌 The detailed configuration characteristics, along with annotated performance curves and scenario overlays, are included in our full report.
Smarter Design, Faster Answers
Our client called out one of the biggest benefits:
“FIDgate revealed viable design scenarios we hadn’t even considered—and reduced our set-up time dramatically.”
Using AI-powered optimization and the unique ability to simulate millions of configurations. No CAD, no spreadsheet juggling.
All-in-one model. Fast iteration. Clean handoffs.
Investing in Better Decisions from the Start
Ready to compare land-constrained vs optimized layouts? Want to explore the business case impact of hybridization or BESS?
Book a free consultation here.
Request the Full Report and Request access to our waitlist, click here
Access this content
Enter your details to unlock the full case study.